The biases behind rating: Uncovering the hidden influences in beer ratings
The main goal of every rating app is to show an objective rating for various objects, which in our case are beers. As each beer receives a lot of reviews from different users, the mean rate of each beer should be quite representative. However, every rate is given by a human, and humans are not objective creatures; they might be influenced by several biases. If the majority of users are subject to the same bias, then the final rate can be significantly impacted. In this project, we want to analyze various biases, such as trends, cultural bias, or naming bias, in the beer reviews’ dataset and see how they influence the rating. Knowing how people are influenced can help us to adjust the rating in order to get more objective and accurate ratings.
| Home |
|---|
| Example |
The Biases Behind Rating: Uncovering the Hidden Influences in Beer Ratings
Introduction
The world of beer reviews is rich with data, offering insights into consumer preferences and biases. The main goal of any rating app is to provide objective scores, helping users navigate a world of choices. However, ratings are inherently subjective, shaped by the biases and perceptions of reviewers.
In this data story, we explore the various biases that influence beer ratings, ranging from time-related trends to cultural and naming biases. By identifying these influences, we propose adjustments that enhance the objectivity and accuracy of ratings.
The Key Questions
Our analysis focuses on the following critical questions:
- Temporal Trends: How do ratings change over time? Are there seasonal variations or spikes linked to events or holidays?
- Anchoring Effects: Do early ratings significantly impact subsequent ones? Are reviewers biased by the first few scores?
- Cultural Biases: Do reviewers rate domestic beers more favorably than international ones? How does beer consumption per capita influence ratings?
- Naming Bias: Does a beer’s name set expectations that influence its rating?
Datasets and Methodology
Datasets
- BeerAdvocate Dataset: Comprising ratings, user information, and brewery details.
- Beer Consumption Data: Total and per capita beer consumption by country (sourced from World Population Review).
Methodology
- Temporal Analysis: Ratings were aggregated by month and year to identify patterns and trends.
- Anchoring Effect: Correlation tests (Pearson and Spearman) were used to evaluate the relationship between early and subsequent ratings.
- Cultural Bias: Domestic and international ratings were compared using t-tests and mean comparisons, and their correlation with beer consumption was assessed.
- Naming Bias: Text analysis and Chi-square tests were used to evaluate the impact of beer names on ratings.
Findings
1. Temporal Trends
Figure 1: Ratebeer Dataset

Observation:
The average rating starts at 3.25 in 2000, dips slightly, and then steadily increases, reaching 3.40 by 2017.
Analysis:
- Upward Trend: Consistent increases in ratings suggest improving beer quality or shifting consumer expectations.
- Initial Dip: Early ratings reflect stricter evaluations or limited beer variety.
- Industry Growth: The rise of craft beer in the mid-2000s likely contributed to higher ratings.
Figure 2: BeerAdvocate Dataset

Observation:
A spike in 2000 (rating > 4.0) is followed by a sharp decline, with steady growth post-2005.
Analysis:
- Spike in 2000: Early adopters may have rated generously, or the sample size was small.
- Recovery: Ratings post-2005 reflect better beer quality and consumer preferences.
- Comparison: BeerAdvocate data exhibits more fluctuations than Ratebeer.
2. Anchoring Effect
Figure 3: Correlation Analysis

Observation:
There is a strong positive correlation between the first and subsequent ratings, with most values clustered near 4.0–4.5.
Analysis:
- Anchoring Effect: Early ratings heavily influence subsequent ones.
- Impact on Objectivity: Over-representation of early opinions biases averages.
3. Cultural Bias
Figure 4: Histogram of Domestic Ratings

Observation:
Most domestic beers have fewer than 100 ratings, with a steep decline and a long tail for popular beers.
Analysis:
- Bias in Domestic Ratings: A few highly rated beers dominate the average.
- Recommendation: Normalize data to account for less-rated beers.
Figure 5: Histogram of International Ratings

Observation:
International beers exhibit a broader distribution, with many beers receiving >1,000 ratings.
Analysis:
- Popularity Disparity: International beers have a wider consumer base.
- Recommendation: Normalize data to enable fair comparisons between domestic and international ratings.
4. Naming Bias
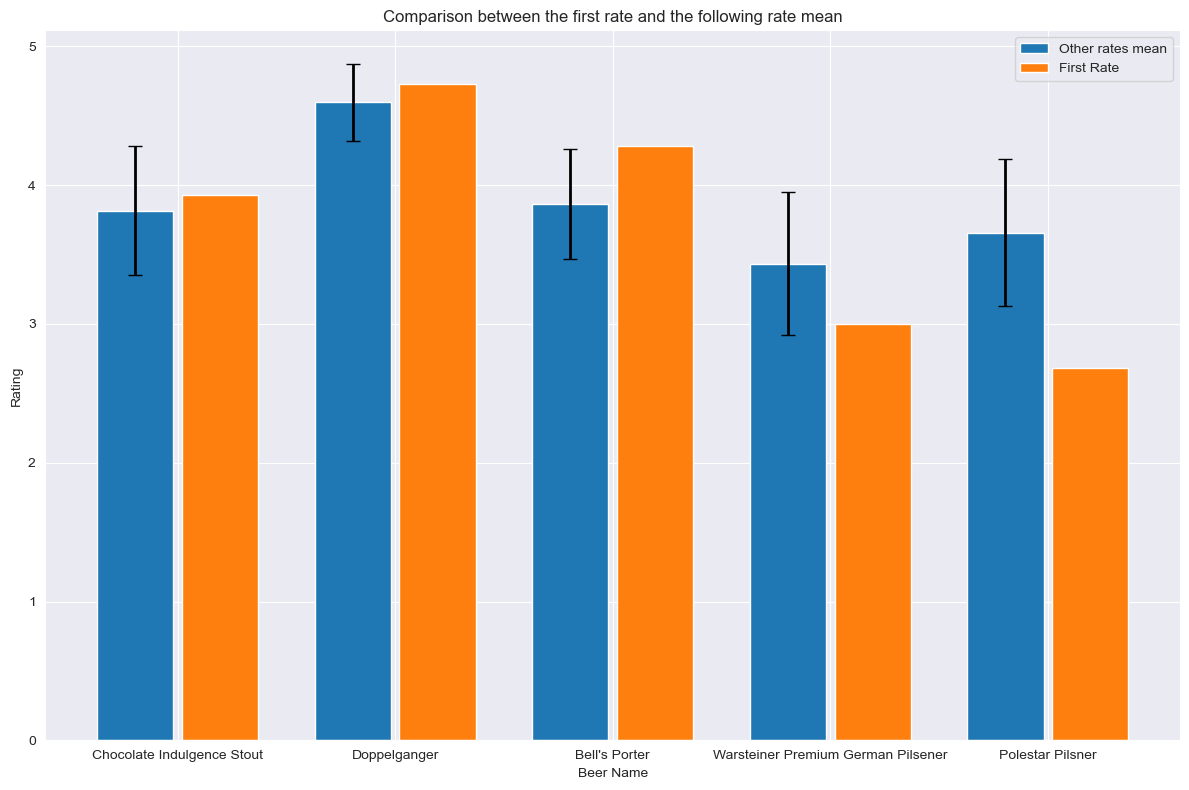
Figure 6: Comparison Analysis

Observation:
First ratings are consistently higher than subsequent averages, indicating optimism bias.
Analysis:
- Expectation vs. Reality: Higher initial ratings reflect enthusiasm or positive impressions from beer names.
- Recommendation: Platforms could anonymize beer names during early reviews to reduce bias.
Key Insights
- Temporal Trends:
- Both datasets show an upward trend in ratings over time, influenced by industry growth and consumer preferences.
- Anchoring Effect:
- Early ratings bias subsequent reviews, requiring adjusted weightings for objectivity.
- Cultural Bias:
- Domestic beers receive more favorable ratings, reflecting cultural preferences.
- Naming Bias:
- Optimistic early ratings may be driven by beer names, suggesting anonymization as a potential solution.
Conclusion
This analysis reveals multiple biases influencing beer ratings, including temporal trends, anchoring effects, cultural preferences, and naming influences. Addressing these biases through normalization, weighting adjustments, and anonymization can lead to more objective and reliable ratings, ultimately benefiting consumers and breweries alike.